Top Real Estate Companies: Profitability Rankings

Key Takeaway: Top real estate companies, as evaluated in this analysis, refers to publicly traded real estate brokerages ranked by earnings per share (EPS) profitability across twenty quarters from 2020 through 2025. The analysis covers eight brokerages across four business models. One brokerage posted a positive cumulative net EPS. Seven ended the period with net losses.
TL;DR About Top Real Estate Companies
- One brokerage posted net gains across five years
- eXp Realty led with 75% profitable quarters
- Traditional models carry higher fixed overhead costs
- Cloud-based brokerages report lower overhead than traditional
- Commission caps limit total annual agent splits
- The NAR settlement tightened margins across all brokerages
- Brokerage profitability affects agent fees and splits
Top real estate companies, as used in this analysis, refers to publicly traded real estate brokerages evaluated by profitability using earnings per share (EPS) data across twenty quarters.
Many agents assume that brokerage size or name recognition reflects financial health. Market presence and profitability are measured differently, and a nationally recognized brand does not indicate a net gain over time.
This article reviews eight publicly traded brokerages, representing traditional, discount, hybrid, and cloud-based models, using quarterly EPS data from 2020 through 2025. It explains how brokerage profitability fits into the broader Smart Agent Alliance brokerage comparison resources agents use to research and compare brokerages.
The analysis covers brokerage model structures, profitability rankings, the financial impact of the NAR settlement, and what the data indicates for agents evaluating their brokerage options:
Table of Contents
Scope of This Brokerage Analysis
This analysis covers eight publicly traded real estate brokerage stocks, representing approximately fifteen well-known companies across four business models.
Five years of balance sheet data provides a consistent basis for evaluating which brokerage models maintained profitability across different market conditions. Profitability directly affects the resources a brokerage allocates to agent support, technology investment, and fee structure.
Real Estate Brokerage Profitability
Profitability Scorecard: Public Brokerages Q1 2020 – Q4 2025
Six years of SEC-reported quarterly net income, ranked by total profitable quarters out of 24. Agent-count growth included for context.
| Brokerage | Ticker | Profitable Quarters (of 24) | Cumulative Net Income 2020-2025 | Cumulative Revenue 2020-2025 | Agent Count (YE 2025) |
|---|---|---|---|---|---|
| eXp World Holdings | AGNT | 16 of 24 | +$74.8M | $23.8B | 83,060 |
| Douglas Elliman | DOUG | 9 of 22 reported | +$15.6M | $6.3B | ~6,800-7,100 |
| Compass | COMP | 2 of 24 | -$1,900M | $33.6B | 21,190 principal |
| The Real Brokerage | REAX | 1 of 24 (Q2 2025) | -$62M (2023-2025) | ~$4.4B | 31,739 |
| Fathom Holdings | FTHM | 1 of 24 (Q2 2020 only) | -$107.3M | $2.0B | ~14,135 |
| LPT Realty | Private | Not disclosed | Not disclosed | Not disclosed | 15,000-22,000 |
| Keller Williams | Private | Not disclosed | Not disclosed | Not disclosed | ~165,000 |
Brokerage profitability determines the resources available for agent tools, fee stability, and operational continuity.
When a brokerage operates at a loss, technology upgrades and platform improvements are typically reduced or postponed.
Unprofitable brokerages carry higher risk of operational changes, including system transitions, rebranding, or restructuring that can affect active transactions.
A brokerage with ongoing losses may respond by increasing agent fees, reducing commission splits, or both. Agent commissions represent the primary revenue source, making agents the most likely target for fee adjustments when expenses exceed income.
Real Estate Brokerage Models
The real estate industry has seen significant changes in brokerage structure over the past decade. Four primary models are represented in the publicly traded market:
Traditional brokerages operate as franchise models with physical office locations and regional management structures. Coldwell Banker and Century 21 are examples.
Discount traditional brokerages operate on the same structural model with reduced commission rates, which produces lower per-transaction revenue.
Hybrid brokerages maintain physical offices and regional management while incorporating digital platforms to reduce operational costs. Compass is an example of this model.
Cloud-based brokerages operate without physical offices or regional management layers, relying on virtual infrastructure to reduce overhead. These models, including eXp Realty, Fathom, and Real, use technology platforms to manage operations. Lower overhead allows for higher agent commission percentages and greater reinvestment in technology.
For a full explanation of eXp Realty’s brokerage fee structure, see: what eXp agents actually get for their brokerage fees
Operational cost structure is a significant factor in brokerage profitability.
Brokerage Comparison Selection
This analysis includes only publicly traded real estate brokerages in the United States. Public companies disclose audited financial statements, enabling consistent, verifiable comparison across brokerages. The eight brokerages reviewed span all four model types. Privately held brokerages are excluded, as their financials are not subject to public disclosure requirements. Brokerages not included in this analysis may share structural and financial characteristics with one of the eight reviewed.
For an overview of top real estate firms including privately held companies, see The Top Real Estate Companies in the U.S..
Brokerages Included in This Analysis
The eight brokerages below represent approximately fifteen well-known brands operating under four distinct model types. Each is publicly traded on a U.S. exchange, providing access to verified quarterly earnings data across the full review period.
- Traditional: Douglas Elliman, RE/MAX andAnywhere (Sotheby’s, Coldwell Banker, Better Homes & Gardens, Century 21, Corcoran) now merged with Compass but still operating as traditional brokerages.
- Traditional Discount: Redfin
- Hybrid: Compass
- Cloud-Based Modern: eXp Realty, Fathom, Real
Top Real Estate Brokerage Firms
The following rankings assess each publicly traded real estate brokerage by profitability, using EPS (earnings per share) as the primary measure. EPS reflects how much profit or loss a company generates per share after all expenses are accounted for.
Twenty quarters were reviewed and each brokerage is ranked by the percentage of quarters in which it posted a profit. Cumulative net EPS gain or loss over the period is included as a secondary measure.
A smaller brokerage may show lower dollar losses simply due to scale. The percentage of profitable quarters provides a scale-neutral comparison, with total EPS as a secondary indicator.ho’s just hoping the next quarter is “the one.”
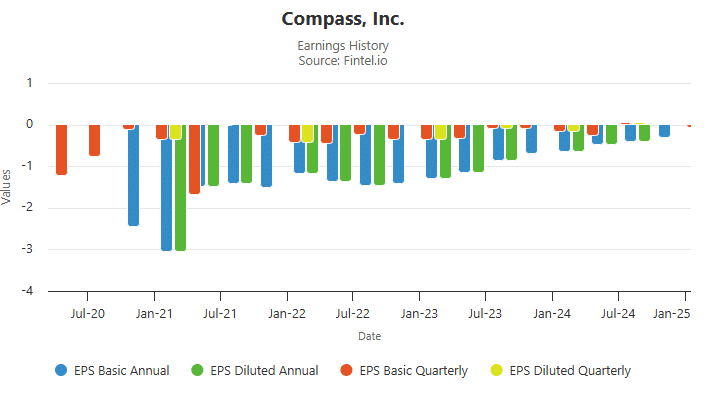
Number 8: Compass
Compass, the hybrid model, reported zero profitable quarters out of 20 reviewed.
Cumulative net EPS over the period was -13.18 per share, the largest loss among the eight brokerages analyzed.
Recent quarters suggest the loss amount may be decreasing, though the brokerage has not posted a profitable quarter in the review period.
The chart below shows quarterly EPS performance:
Number 7 – Real
Real, a cloud-based brokerage, also reported zero profitable quarters out of 20 reviewed, a 100% unprofitable rate over five years.
As a smaller company, Real’s cumulative net EPS loss of -$0.56 is lower in dollar terms than Compass. Scale accounts for the difference.
Real’s losses began small and increased over the five-year period. Recent data does not indicate a clear trend toward profitability.

Number 6 – Fathom
Fathom, a cloud-based brokerage, reported one profitable quarter out of 20 reviewed, a 95% unprofitable rate over five years.
The single profitable quarter produced a minimal gain relative to cumulative losses. Fathom posted a total net EPS loss of -5.28 per share over five years.
Whether recent trends indicate improving performance remains uncertain based on available data.

Number 5 – Redfin
Redfin, a traditional discount brokerage, posted losses in 17 of 20 quarters, an 85% unprofitable rate.
Redfin’s cumulative net EPS loss over the period was -6.94 per share.
Recent quarters indicate that losses may be decreasing. Discount brokerage models that rely on reduced commission rates require tightly managed cost structures to approach profitability.

Number 4 – Douglas Elliman
Douglas Elliman reported 6 profitable quarters out of 16 reviewed, a 62.5% unprofitable rate.
As a smaller company, the total net loss of -$0.31 per share is lower in dollar terms than larger brokerages with similar loss ratios.
Losses have been consistent across the review period. Douglas Elliman has not achieved overall profitability over the five-year review period.

Number 3 – Anywhere
Anywhere is a traditional brokerage holding company that includes Sotheby’s, Coldwell Banker, Better Homes and Gardens, Century 21, and Corcoran. The portfolio scale produces some cost efficiency.
Anywhere reported 13 profitable quarters out of 20 reviewed, a 65% profitability rate.
Loss quarters show significant negative EPS results. The cumulative net EPS over five years is -$4.94, indicating that loss quarters substantially offset the gains.
Despite a higher rate of profitable quarters, cumulative net EPS over five years remains negative.

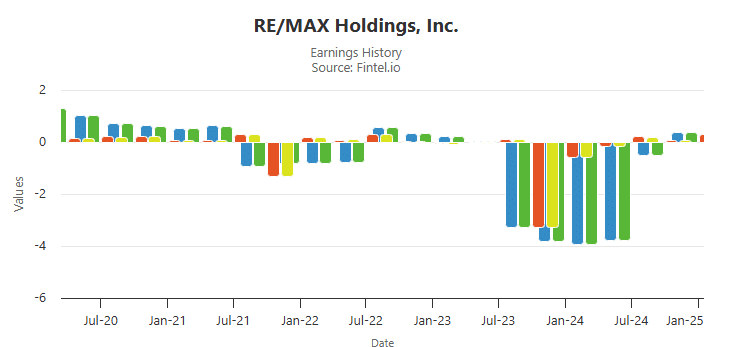
Number 2 – RE/MAX
RE/MAX, a traditional brokerage, posted 13 profitable quarters out of 20, matching Anywhere’s 65% profitability rate.
RE/MAX posted a cumulative net EPS loss of -$3.43 per share over five years. Loss quarters show significant negative EPS results.
RE/MAX has a relatively high rate of profitable quarters but remains net-negative over the five-year review period.
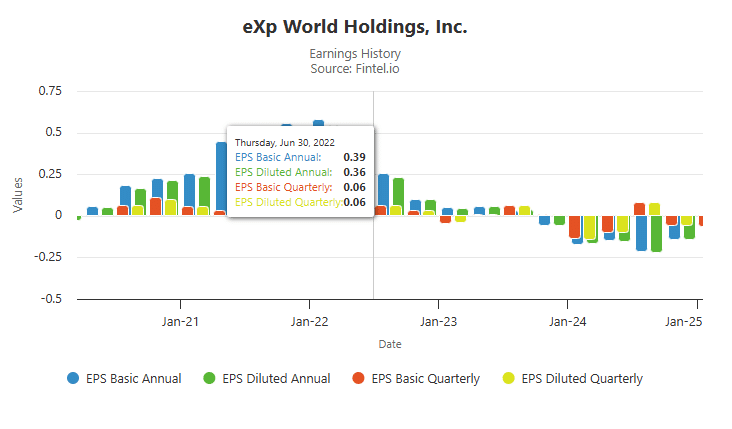
Number 1 – eXp Realty
eXp Realty posted profitable results in 15 of 20 quarters, a 75% profitability rate, the highest among the eight brokerages analyzed.
eXp Realty is the only publicly traded real estate brokerage in this analysis to post a cumulative net gain over five years, at +$0.66 per share.
The profitable quarters produced gains that exceeded the cumulative loss quarters, resulting in a positive net EPS.
eXp Realty’s positive cumulative EPS over five years distinguishes it from the other brokerages reviewed, all of which ended the period with net losses.
Future Outlook for Publicly Traded Brokerages
The five-year earnings data reflects three distinct market periods: stable pre-pandemic conditions, the 2021 to 2022 transaction surge, and the subsequent market correction. The data shows which brokerage models maintained profitability across these conditions.
Effects of the NAR Settlement
Every brokerage has been affected by the NAR settlement, which changes how buyer agent commissions are structured. As commission structures change and transaction volume per agent may decrease, industry margins may tighten, particularly for agents in their early years.
The impact varies depending on a brokerage’s revenue model.
Brokerages without commission caps collect a percentage of every transaction, which increases their exposure to volume decreases. Brokerages with commission caps, such as eXp Realty’s $16,000 annual cap, limit the amount collected from high-producing agents after the cap is reached. A reduced transaction fee applies to subsequent transactions. eXp Realty maintained profitability while operating this cap structure, the only brokerage in this analysis to do so.
Cost Structure Challenges for Traditional Brokerages
Traditional brokerages operate with higher fixed costs than cloud-based models. Their cost structure includes franchise fees, physical office leases, and regional management layers. These costs reduce the revenue available for agent tools and support.
Cloud-based brokerages operate without these fixed costs, which allows for different commission structures and technology investment levels. Some cloud-based brokerages provide access to physical workspace on an as-needed basis.
Long-Term Viability of Traditional Models
As more agents transition to cloud-based brokerages, traditional models may face difficulty covering fixed overhead. A reduction in agent count at traditional brokerages may lead to increased fees or reduced splits.
This transition is unlikely to occur rapidly. Industry shifts of this scale typically develop over multiple years or decades.
Cloud-based models are not guaranteed to be profitable, as the data for Real and Fathom illustrates. If fee structures do not support profitability, the same cost pressures apply regardless of brokerage model.
What Agents Also Ask
How do I research a real estate brokerage’s financial health?
Publicly traded brokerages file quarterly and annual financial reports with the SEC. Earnings per share data from these filings provides a consistent basis for evaluating profitability over time. Privately held brokerages do not disclose audited financials, which limits the comparisons available.
What does earnings per share mean for a real estate brokerage?
Earnings per share measures the profit or loss a publicly traded company generates per share of stock after all expenses. A positive result indicates profitability for that period; a negative result indicates a net loss. Cumulative data over multiple quarters shows the overall trend direction.
Did the NAR settlement affect brokerage profitability?
The NAR settlement changes how buyer agent commissions are structured, affecting transaction revenue across all brokerage types. Brokerages without commission caps have greater exposure to per-transaction revenue changes. The long-term financial impact will depend on how each model adjusts its fee structure.
Are cloud-based brokerages more profitable than traditional ones?
The five-year data in this analysis shows mixed results across both model types. eXp Realty, a cloud-based brokerage, was the only net-positive brokerage reviewed. Two other cloud-based brokerages posted losses in nearly all quarters, indicating that model type alone does not determine profitability.
Why This Matters
Brokerage profitability data provides a structural basis for evaluating which models can sustain agent support across market conditions. Unprofitable brokerages must eventually adjust fee structures, reduce services, or restructure; each outcome affects agents directly.
At eXp Realty, all agents receive the same core brokerage platform, including compliance, compensation, and access to company divisions. What differs is the sponsor ecosystem an agent aligns with. The sponsor an agent selects shapes which tools, training, and attraction systems they have access to, if any, access to brokerage financial comparison tools or structured onboarding resources specific to eXp agent evaluation.
Related Topics
Cloud vs Traditional Real Estate Brokerages Explained
Frequently Asked Questions
Share This Post

Doug Smart
Co-Founder, Smart Agent Alliance
Licensed real estate agent - license #02191298 (CA) - Brokered by eXp Realty
Top 1% eXp team builder. Designed and built this website, the agent portal, and the systems and automations powering production workflows and attraction tools across the organization.
Already with eXp and building a team? See the SAA Partner Program